Blog··9 min read
How to Use Link-in-Bio Analytics
How to read link-in-bio analytics: traffic sources, top countries, device mix, and visit trends, and how to act on what the numbers tell you.
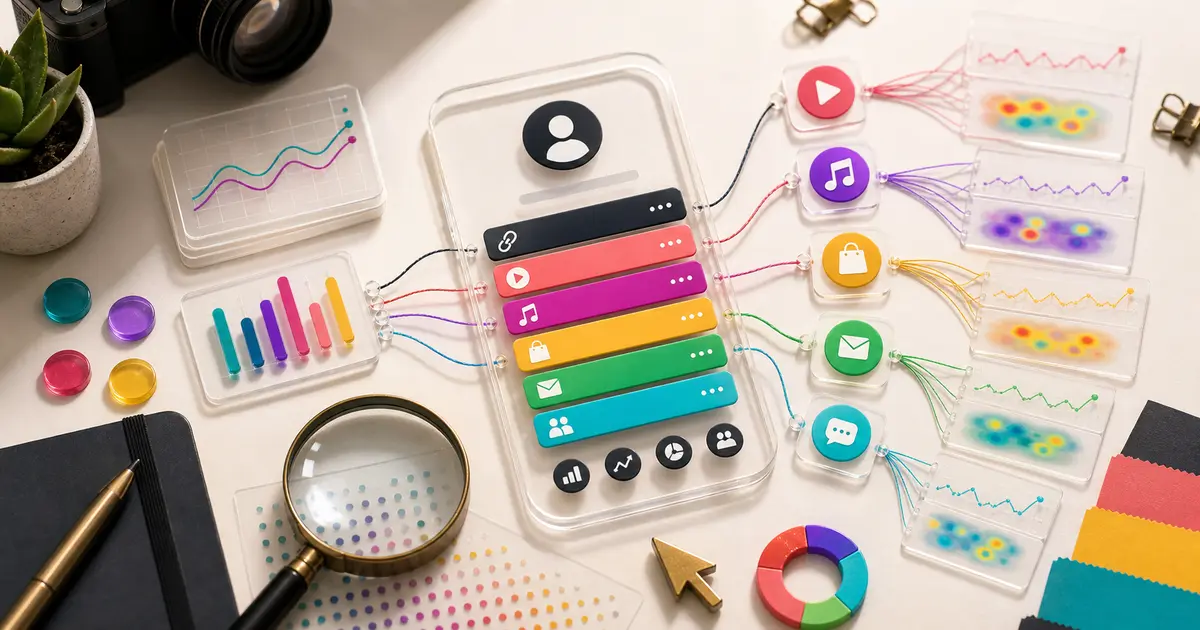
Link-in-bio analytics answer two practical questions: where do fans come from before they reach your page, and what do they do once they are there? Get honest answers to those and you stop guessing which platform is worth your time and which parts of the page are dead weight.
Most link-in-bio tools report analytics at one of two levels. Some show page-level numbers: how many people visited, where they came from, what country they were in, and what device they used. Others also show per-link clicks: exactly which button got tapped. Both are useful, and they answer different questions. This guide covers how to read each kind, then how to act on it, and it is honest about which numbers ByteSize actually gives you so you are not chasing data that is not there.
One thing up front: on ByteSize, analytics are a Creator Pro feature, not a free-plan one. The free Start plan gives you the page, unlimited links, and embedded content, but the numbers below live on Creator Pro at $9/mo, or $90/year (2 months free). If you are on any tool's free tier, check what it reports before you build a workflow around a metric you cannot see.
Decide What You Expected Before You Open the Dashboard
Analytics without an expectation are just trivia. Before you look at a single number, decide what you wanted visitors to do this month.
- A musician might expect fans to stream the newest release.
- A streamer might expect viewers to join Discord or catch a live show.
- A YouTuber might expect visitors to subscribe or watch the latest upload.
- A creator selling something might expect visits to the shop or a specific product.
With a clear expectation, the data becomes a verdict: is the page doing the job or not? Without one, you will stare at charts and take away nothing. Write the expectation down before you look, so you are not tempted to invent a story that flatters whatever the numbers happen to show.
Read Your Traffic Sources First
Traffic sources tell you where visitors were right before they landed on your page: TikTok, Instagram, YouTube, a direct visit, a search result, and so on. This is usually the most decision-changing number a link-in-bio tool can give you, and it is often the most ignored.
Why it matters: it tells you which platform is actually sending people, which is frequently not the one you spend the most time on. If ninety percent of your visits come from TikTok but you pour your energy into Instagram, the data is telling you where your reach really is. It also tells you what a visitor just saw. Someone arriving from a TikTok about a product has a different intent than someone arriving from your YouTube channel page, and your top block should match whichever source dominates.
A practical move: after a post or video goes out, check whether the traffic bump shows up from that source, and whether your page's current priority matches what that post promised. If a TikTok said "link in bio for the discount code," and TikTok is your top source that week, the discount had better be the first thing on the page.
Look at Where Your Visitors Are
Geography, usually shown as top countries, matters more than it first appears. It shapes timing, language, and offers.
If a large share of your audience sits in a time zone eight hours from yours, your "post and share the link" timing is probably off. If a country you do not target keeps showing up, that might be an audience worth leaning into, or a sign that a specific post traveled somewhere unexpected. For creators who sell, geography also flags practical things: shipping regions for merch, currency for pricing, or whether a region-locked link is sending people to a dead end.
You do not need to react to every country in the list. Watch for the big shares and the surprises, and ignore the long tail.
Check the Device Mix
Almost all link-in-bio traffic is mobile, but the exact split still earns a look. If your analytics show that nearly everyone visits on a phone, and most will, then your page has to be judged on a phone, not on the desktop editor where you built it.
That single fact changes how you work. Check your labels on a real phone screen, not the wide preview. Make sure your priority link sits above the first scroll on mobile. Confirm that an embedded video or player does not push everything important out of view. A page that looks balanced on a laptop can bury the important link on the device where nearly all your fans actually see it.
Watch Trends, Not Single Days
The most common analytics mistake is overreading a single good day. One viral post or one unusual afternoon does not prove a lasting pattern, and building around it will send you chasing noise.
Look for repeated signals across weeks:
- The same traffic source dominating month after month.
- A new campaign drawing visits after you pinned it to the top.
- A steady climb or drop in visits that lines up with something you changed.
- A seasonal pattern that repeats, like more traffic when you post consistently.
Treat analytics as a decision aid, not a final verdict. A trend you can see three weeks running is worth acting on. A spike from one Tuesday is not.
Thinking in Terms of Per-Link Clicks
Some tools also report per-link clicks: the exact count of taps on each individual button. If your tool offers this, it answers a sharper question than page-level data can. Tools that show per-link clicks let you see which specific destination is winning attention, whether your priority link is actually earning its spot, and which buttons are pure clutter that never get touched.
Even without per-link numbers, you can reason about the same thing indirectly. If your traffic is overwhelmingly from TikTok and you know your recent TikTok pushed one offer, a jump in overall visits after that post is a decent proxy for interest in that offer. Combine your traffic-source data with what you know you promoted, and you can usually infer which link is doing the work, even when you cannot count the taps directly. It is less precise, but it points the same direction.
What ByteSize Actually Reports
To be straight about our own tool: ByteSize analytics are page-level, and they live on Creator Pro, not the free plan. On Pro you can see your visitors and visits, your traffic sources, the countries fans come from, and the device mix. That covers the "where do they come from and how many" side of the questions above.
What ByteSize does not report is a per-link click count for each individual button. So when this guide talks about watching per-link taps, treat that as general link-in-bio thinking rather than a ByteSize feature. On ByteSize, you work from the page-level picture: which sources send people, where they are, and how visits trend over time, then you match your page's priority and previews to what those numbers show. As of July 2026 that is the honest shape of what is included, and we would rather you know it before upgrading than after.
What to Change First When a Page Underperforms
When the numbers say the page is not doing its job, start with the cheapest changes and work up:
- Match the top block to your top source. If most traffic comes from one platform, make the first thing on the page match what that platform's audience expects.
- Rewrite vague labels. "My stuff" and "click here" tell a visitor nothing. Say where the tap leads.
- Add or improve a content preview. For music and video, an embedded preview convinces before the click. On ByteSize, YouTube uploads auto-sync, and Spotify and Apple Music show up as playable players.
- Remove stale links. A destination that adds nothing and gets no attention is just clutter. Cut it.
- Fix the mobile view. If device data says everyone is on a phone, judge and fix the page on a phone.
- Give it a few weeks. Change one thing, then watch the trend before changing the next. Chasing every daily wiggle undoes your own signal.
If you want the broader page structure behind these tweaks, read how to build a link-in-bio setup for creators and the creator profile page examples for structure by creator type. If you are still choosing a tool, compare the best link-in-bio tools.
Bottom Line
Good link-in-bio analytics make your page clearer, not busier. Start with an expectation, read where visitors come from, notice where they are and what device they use, and watch trends across weeks instead of reacting to single days. Then change the page around what the data shows and give each change time to prove itself.
If you want these numbers on your own page, they come with Creator Pro. You can claim a ByteSize handle for free first, build the page, and upgrade when the analytics are worth it to you.
FAQ
Does ByteSize show analytics on the free plan?
No. The free Start plan includes the page, unlimited links, embedded content, and a public URL, but analytics are part of Creator Pro at $9/mo, or $90/year (2 months free), as of August 2026. If you want to see traffic sources, countries, devices, and visit trends, that is the tier they live on.
What analytics does ByteSize actually include?
Page-level metrics on Creator Pro: your visitors and visits, traffic sources, the countries visitors come from, and their device mix. It does not report a separate click count for each individual link, so plan around the page-level picture rather than per-link taps.
Are traffic sources or per-link clicks more useful?
They answer different questions. Traffic sources tell you which platform is sending people and what they just saw, which usually changes where you spend your effort. Per-link clicks, in tools that offer them, tell you which specific button wins attention. If you only get one, page-level traffic sources drive more of your decisions, because they point you at the platform doing the real work.
How often should I check link-in-bio analytics?
A quick look after any major post, video, stream, or launch, plus a slower monthly review to spot trends. Checking daily tends to make you overreact to single-day spikes. The useful signals show up across weeks, not hours.
Why does device data matter if almost everyone is on mobile?
Because it confirms you should judge the page on a phone, not on the desktop editor. If your analytics show that nearly all visits are mobile, check your labels, priority link, and previews on a real phone screen. A page that looks fine on a laptop can bury the important link where most fans will never scroll to it.
Read next
Keep going
- How to Build a Link-in-Bio Setup for CreatorsA practical framework for deciding what belongs on your creator bio link, what to pin first, and how to keep the page useful as your content changes.
- How to Make a Linktree, Step by Step (Or Skip It)A complete, honest walkthrough of how to make a Linktree, plus what a plain link list can't do and a faster way to share everything you make.
- How to Add a Link to Your TikTok Bio (2026 Guide)How to add a link to your TikTok bio in 2026: the clickable website field, whether you really need 1,000 followers, and how to share more than one link.
Plan your next step
Turn the guide into a better bio page
- Browse every creator guideMove from setup questions into use cases, comparisons, and link-in-bio fundamentals.
- Compare Linktree alternativesChoose a tool by content, commerce, maintenance, pricing, and creator fit.
- See Bytesize pricingCompare the free Start plan with Creator Pro before you build your page.